Features
SonarQube Overview Panel
The SonarQube Overview Panel in SonarQube Connector for Jira provides a comprehensive overview of the code quality and security status of your SonarQube projects directly within Jira.
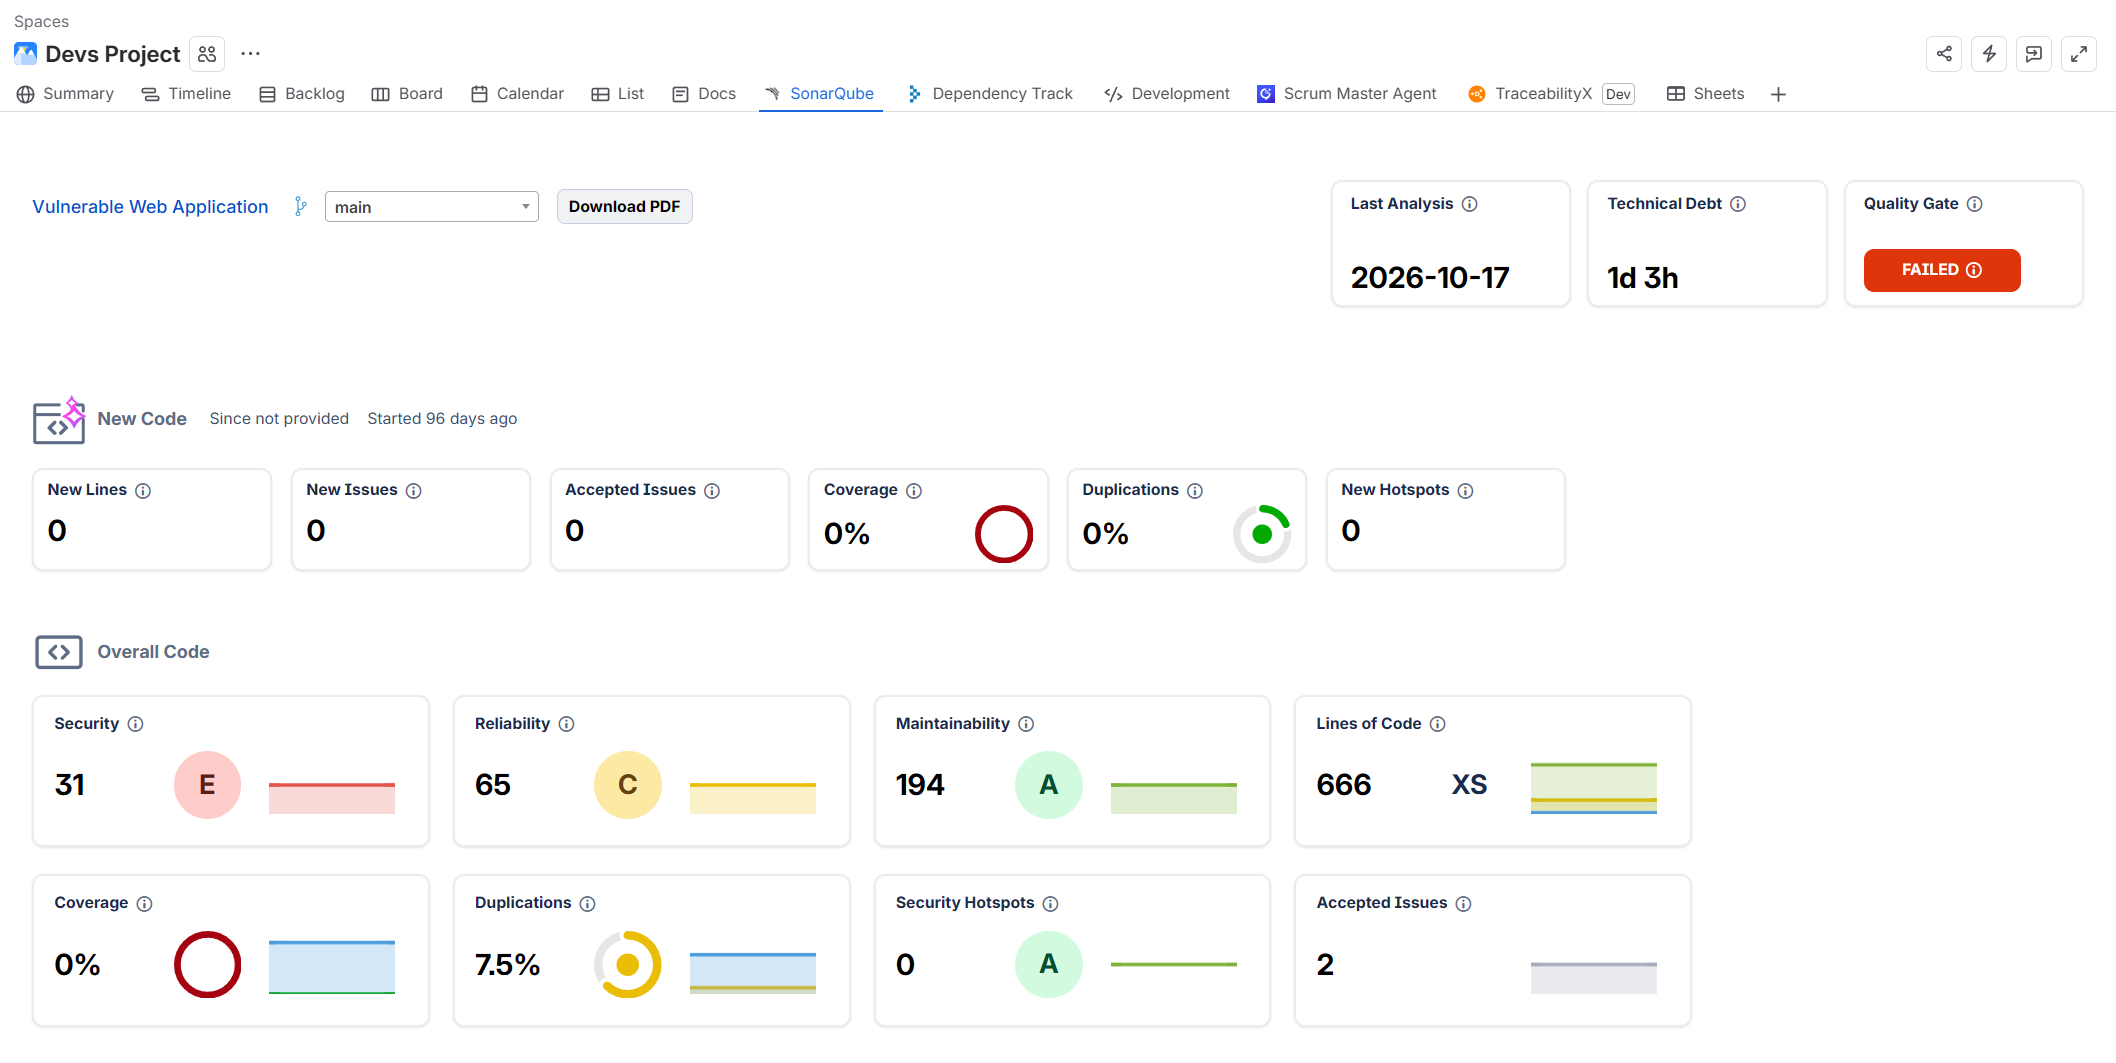
This panel allows you to monitor key software quality metrics, review the results of the latest analysis, and identify potential security, reliability, and maintainability issues without accessing SonarQube separately.
The information is organized into three main sections:
1. General Project Information
The top section of the panel displays essential information about the SonarQube project:
-
Project Name: Displays the name of the analyzed project, with a direct link to SonarQube.
-
Branch: Allows you to select a specific project branch and view its corresponding quality metrics.
-
Last Analysis: Shows the date of the most recent code analysis.
-
Technical Debt: Estimates the effort required to resolve maintainability issues detected in the codebase.
-
Quality Gate: Displays the project's Quality Gate status, indicating whether the code meets the defined quality standards.
This section also includes the Download PDF button, which allows you to export the analysis results as a PDF report.
2. New Code: Metrics for New Code
The New Code section displays quality metrics related to new or modified code within the period defined in SonarQube.
It includes the following indicators:
|
METRIC |
DESCRIPTION |
|---|---|
|
New Lines |
Number of new lines of code added during the defined period. |
|
New Issues |
Number of new code quality or security issues detected. |
|
Accepted Issues |
Number of issues in the new code that have been accepted. |
|
Coverage |
Percentage of new code covered by tests. |
|
Duplications |
Percentage of duplicated code in the new code. |
|
New Hotspots |
Number of new Security Hotspots identified that require security review. |
These metrics help development teams evaluate the quality of recently introduced code and determine whether it meets their established quality standards.
3. Overall Code: Project-Wide Quality Metrics
The Overall Code section provides a complete overview of the analyzed codebase, including both existing and newly added code.
The following metrics are available:
|
METRIC |
DESCRIPTION |
|---|---|
|
Security |
Number of security issues detected and the corresponding security rating. |
|
Reliability |
Number of reliability issues detected and the corresponding reliability rating. |
|
Maintainability |
Number of maintainability issues detected and the corresponding maintainability rating. |
|
Lines of Code |
Total number of analyzed lines of code and the project's size classification. |
|
Coverage |
Percentage of code covered by tests. |
|
Duplications |
Percentage of duplicated code across the project. |
|
Security Hotspots |
Number of identified Security Hotspots and their corresponding rating. |
|
Accepted Issues |
Total number of accepted issues in the project. |
Metrics are displayed in visual cards featuring numerical values, color-coded indicators, and, where applicable, ratings ranging from A to E, making it easier to assess the overall health of the codebase.
Code Insights
The Code Insights section of SonarQube Connector for Jira provides a detailed overview of the code quality and security issues detected by SonarQube, directly within Jira.
This section allows development and security teams to explore detected issues, identify the rules associated with them, and prioritize remediation efforts based on their impact.
The information is organized into different views, making it easier to analyze issues across multiple quality and security categories.
1. Code Insights Views
The Code Insights section includes five views:
|
VIEW |
DESCRIPTION |
|---|---|
|
Issues Breakdown |
Displays the SonarQube rules associated with detected issues, including their impact, attributes, programming language, and number of occurrences. |
|
Hotspots Breakdown |
Provides access to information about Security Hotspots detected in the analyzed code. |
|
Reliability |
Focuses on issues that affect code reliability and may lead to unexpected behavior or failures. |
|
Security |
Focuses on security-related issues that could introduce vulnerabilities into the application. |
|
Maintainability |
Focuses on issues that make the code more difficult to understand, modify, or maintain. |
Users can switch between these views to focus on specific aspects of software quality and security.
2. Issues Breakdown
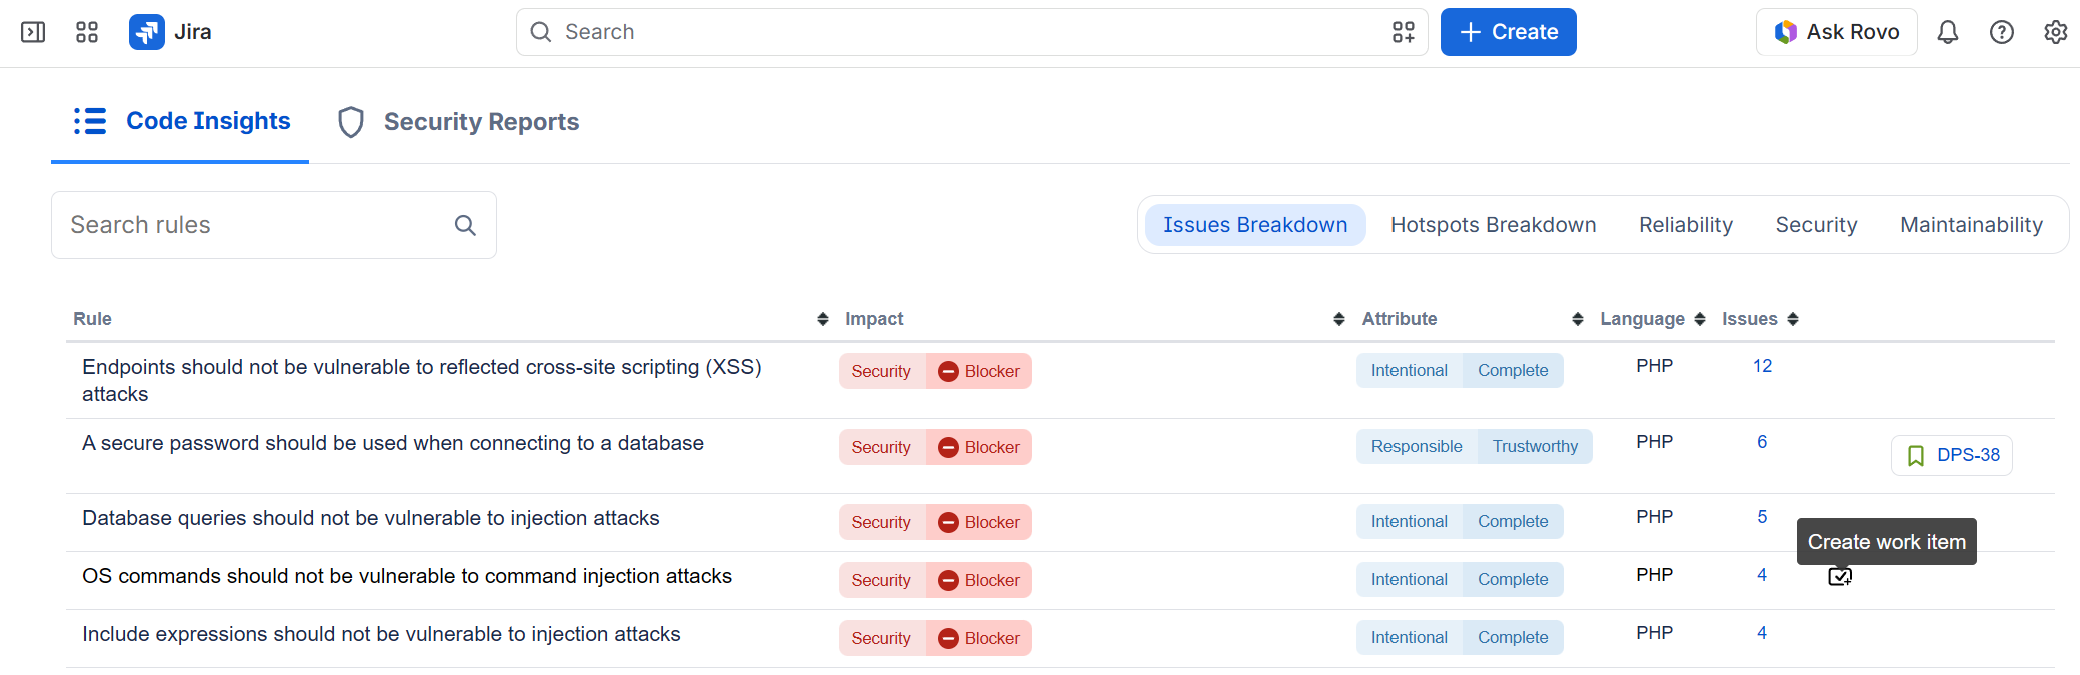
The Issues Breakdown view displays a detailed table of the SonarQube rules associated with the issues detected in the project.
Each row represents a SonarQube rule and provides the following information:
|
COLUM |
DESCRIPTION |
|---|---|
|
Rule |
Name of the SonarQube rule associated with the detected issues. |
|
Impact |
Software quality impacted by the rule (Security, Reliability, or Maintainability) and its severity level, such as Blocker. |
|
Attribute |
Clean Code attributes associated with the rule, such as Intentional, Complete, Responsible, or Trustworthy. |
|
Language |
Programming language affected by the rule. |
|
Issues |
Total number of detected issues associated with the rule. |
Here you will also find two additional columns: one with the button to create a work item and another showing the work item that has already been created.
The Search rules field allows users to search for specific rules, while the sortable columns help organize the results.
Security Reports
The Security Reports section in SonarQube Connector for Jira displays security results organized into the CWE Top 25, OWASP Top 10, OWASP ASVS, and ISO 5055 tabs.
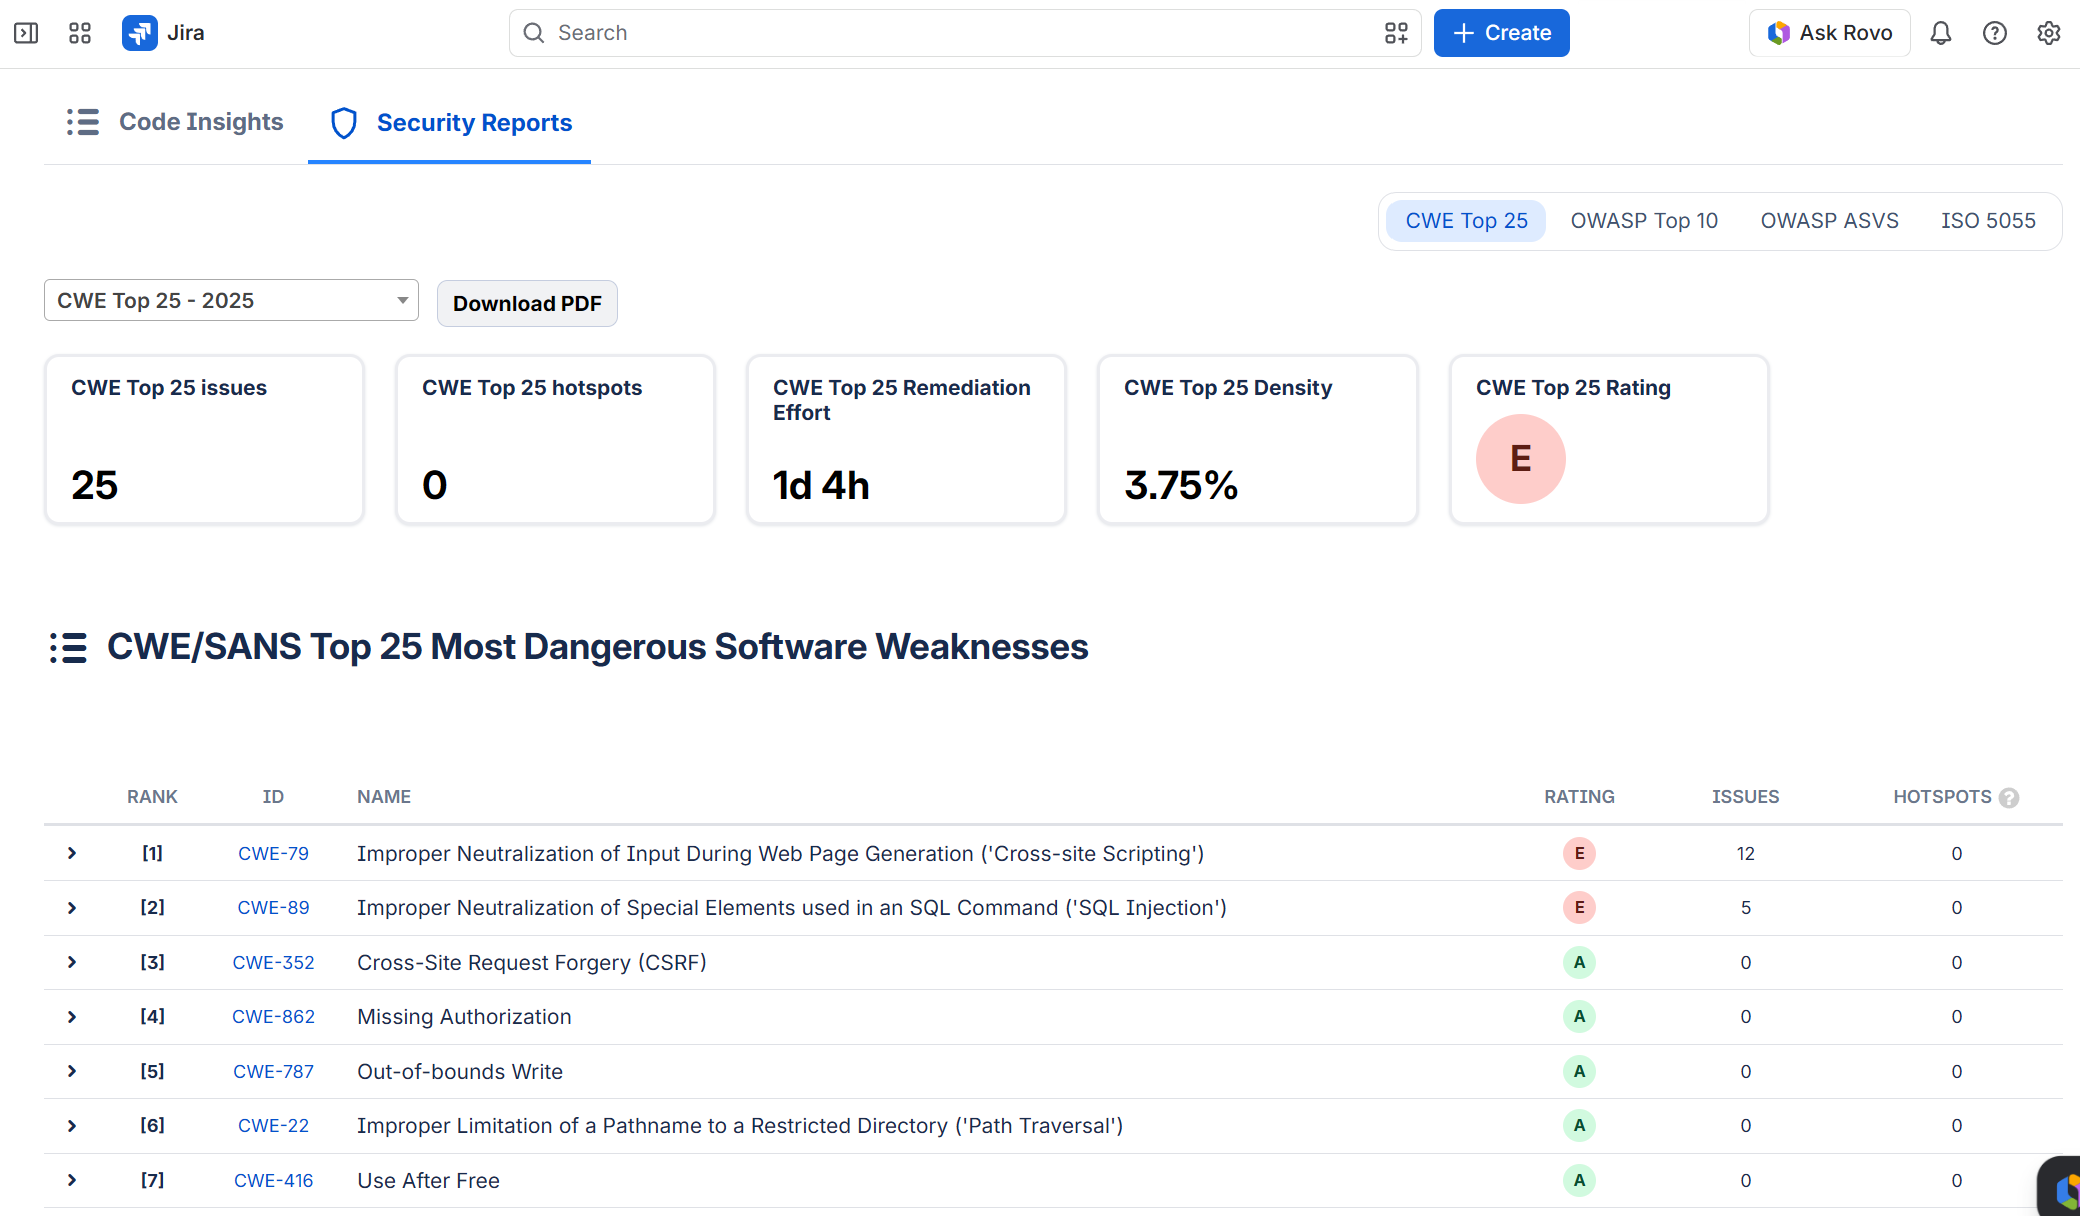
In the CWE Top 25 tab, you can select the classification edition from the dropdown and download the report using the Download PDF button.
The top section displays five summary indicators:
-
CWE Top 25 issues: number of issues associated with this classification.
-
CWE Top 25 hotspots: number of associated Security Hotspots.
-
CWE Top 25 Remediation Effort: estimated remediation effort.
-
CWE Top 25 Density: density value for this classification.
-
CWE Top 25 Rating: rating for this classification.
The table below lists the CWE Top 25 weaknesses, showing their rank, identifier, name, rating, and number of associated issues and Security Hotspots. Each row includes an expand control.
Create Jira work items
SonarQube Connector for Jira lets you create Jira issues from code quality and security issues detected by SonarQube.
Before you begin, check that:
-
SonarQube Connector for Jira is installed on your Jira instance.
-
The connector is configured to access your SonarQube projects.
-
At least one code analysis has been completed in SonarQube and issues have been detected.
Once you have completed these checks, open the Jira project linked to SonarQube and access the information provided by SonarQube Connector for Jira.
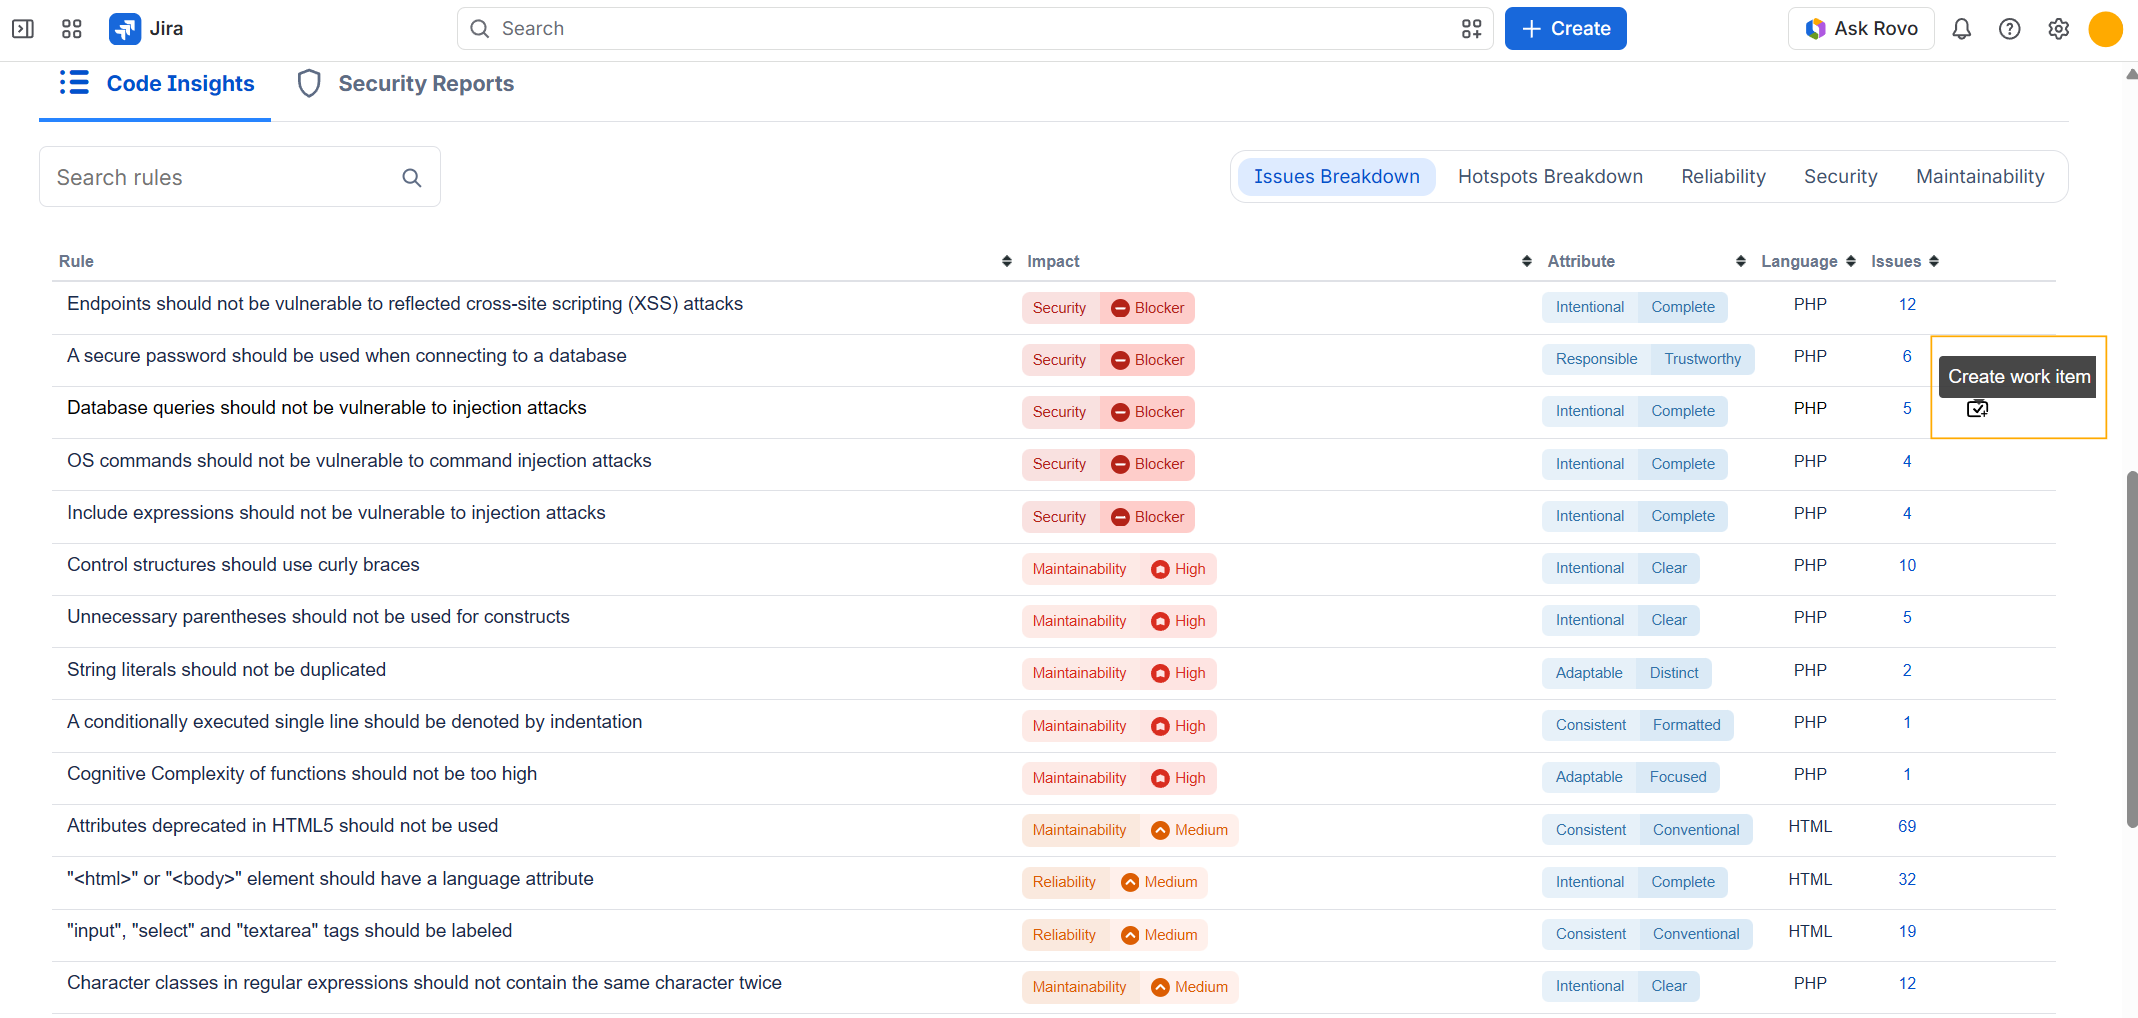
Once you have located the SonarQube rule, follow these steps:
-
Find the create work item button in the row corresponding to the SonarQube rule.
-
Click the button to create the Jira work item. The connector uses the SonarQube rule information to generate it.
Once the work item has been created, its key will appear in the same row as the SonarQube issue, right next to the create work item button.
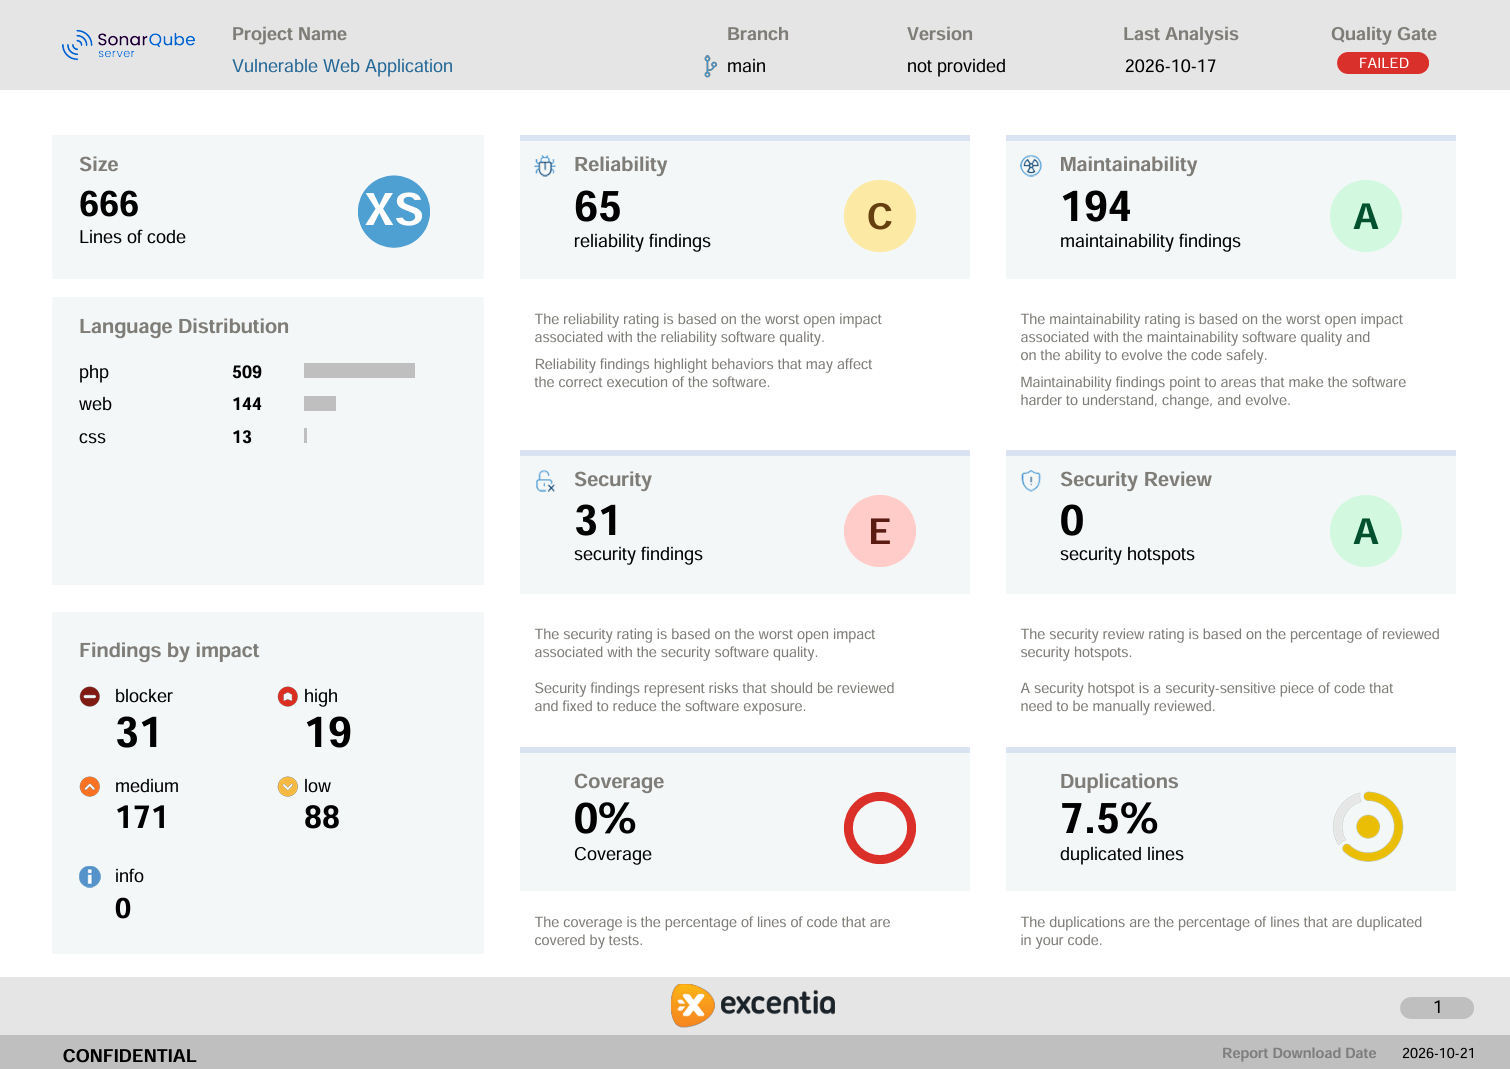
PDF Overview
SonarQube Connector for Jira lets you download a PDF report containing the code quality and security analysis results for your SonarQube projects, directly from Jira.
The SonarQube Evidence Report gives development and security teams a detailed view of the codebase, including metrics and trends that help identify issues, make informed decisions, and prioritize improvements.
How to download the PDF report
To download the report, follow these steps:
-
Open the Jira project linked to SonarQube.
-
Open the SonarQube Connector for Jira section.
-
Go to the Overview panel, where you will find the report download option.
-
Click the download option to get the PDF report.
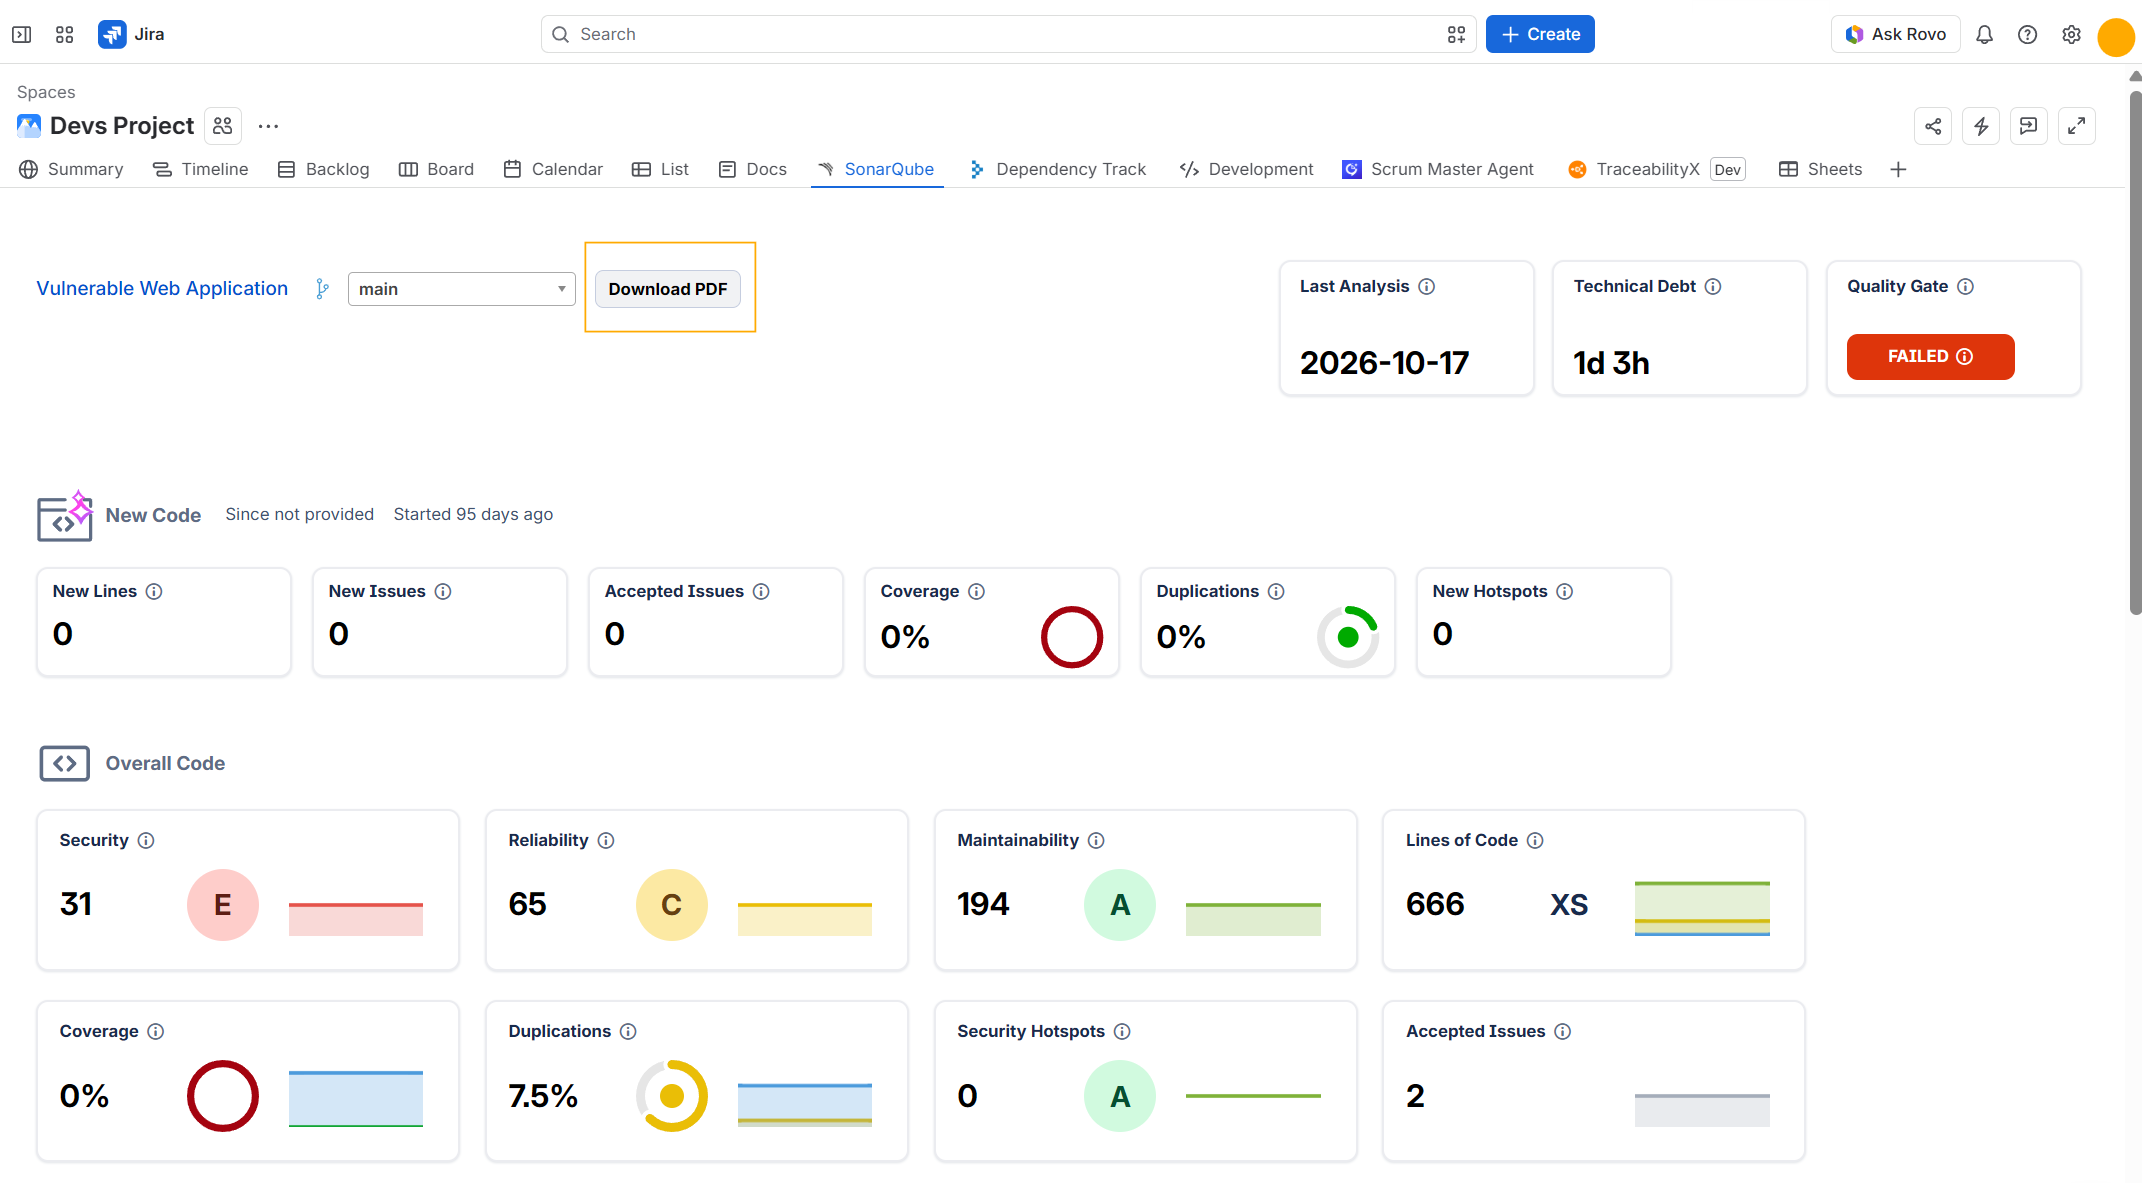
Once downloaded, you can share the report with other team members, document the state of code quality and security, and make it easier to track the issues detected.
This feature provides SonarQube results in a document that is easy to review and share, without needing to access the analysis platform directly.